Chapter 5: Counting the Treasure
The Pie Chart Coloring Page
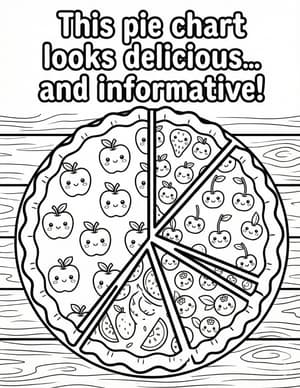
"This pie chart looks delicious... and informative!"
A literal fruit pie on a table, cut into slices of different sizes.
About this page
Page 62 serves up the most delicious joke in the book: the pie chart is an actual pie. Some slices are big, some are small, and that is the entire lesson. A pie chart shows how one whole thing gets divided into parts, and bigger slices mean bigger shares. Children compare slice sizes at every birthday party, so this concept is already living in their hands and stomachs. It is a perfect example of how data is everywhere in a child's ordinary day, hiding in dinner plates, pizza boxes, and dessert. Understanding parts of a whole starts long before anyone says the word fraction.
The research skill
Reading proportions, meaning how big one part is compared with the whole, is the skill baked into this pie. Every slice is a share, and all the slices together must make exactly one whole pie. That rule matters in real research: if a pie chart's slices are drawn the wrong size, it tells a false story even when the numbers are right. Chapter 5 is about turning counts into pictures that stay honest. Your child will meet pie charts in school when a class graphs favorite colors or how everyone travels there.
Try it at home
Make a paper-plate pie chart of family votes. Ask everyone at home one question, such as their favorite fruit or favorite breakfast. Divide a paper plate into as many equal slices as there are voters (an adult can help keep them even). Your child colors one slice per vote, using a different color for each answer and keeping matching colors side by side. Step back and ask: which answer takes up the most of the plate? What would change if one more person voted?
Talk about it while you color
- Which slice of pie would you pick, and who should get the biggest one?
- If this pie showed your family's favorite fruits, what would the big slice be?
- How could you cut a pie so everyone gets exactly the same amount?