Chapter 5: Counting the Treasure
The Bar Graph Coloring Page
"Bar graphs show us who has the most."
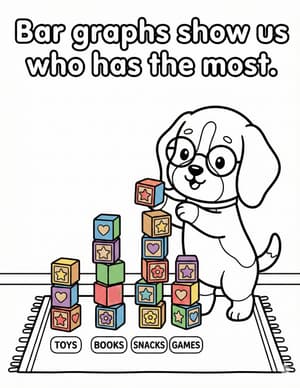
Detail Dog building towers of blocks. Some are tall, some are short.
About this page
Detail Dog turns a pile of blocks into a skyline on page 63, and without meaning to, he builds his first bar graph. Each tower stands for something being counted, and the tallest tower wins the who-has-the-most question at a single glance. That is the magic of a bar graph, it lets your eyes do the comparing instead of your memory. Stacking and comparing towers is something children do naturally, which is exactly the instinct celebrated in Detail Dog's data journal. Here in Chapter 5, the Squad's collected treasure finally starts taking shape as something you can see.
The research skill
Labeling the categories on a graph is what turns stacks of blocks into information, and Detail Dog's towers sit above four little tags: Toys, Books, Snacks, and Games. Without those words, a tall tower is just tall. With them, it answers a question. Researchers name every bar and make each block stand for the same amount, so heights can be compared fairly. That is the heart of Chapter 5's work with charts. In the early grades, your child will build picture graphs and bar graphs from class votes in exactly this way.
Try it at home
Build a real block bar graph on the floor. Write four labels on scraps of paper, like Detail Dog's toys, books, snacks, and games, or choose your own. Ask each family member (or stuffed animal) which one they like best, and add one block above that label per vote. Keep the labels in a row so every tower starts from the same line. Then ask your child three questions: which tower is tallest, which is shortest, and how many more blocks does the tallest have?
Talk about it while you color
- Which tower is the tallest, and which one is the shortest?
- If each tower counted a snack you ate this week, which snack tower would be tallest?
- What could Detail Dog do to make the little tower catch up to the big one?