Chapter 5
Counting the Treasure
Charts, graphs, pattern recognition, and making sense of findings
The experiment is done, and now the friends are surrounded by treasure: observations, tallies, and notes. Chapter 5 is about turning that pile into meaning. Across pages 61 through 80, Detail Dog takes the lead, because making sense of data takes exactly the kind of careful attention he is famous for.
Kids color their way through data rain, watch numbers take shape as the pie chart and friendly graphs, and learn to spot the pattern hiding in the noise. The chapter treats data the way children naturally do, as something to sort, stack, and marvel at, which is why data really is everywhere once kids start looking: in the weather, in dinner choices, in how often the dog barks at the mail carrier.
If your child enjoys this chapter, extend it with Detail Dog's make-it-yourself data journal, which gives them a place to collect their own tallies and charts. And when they proudly show you a lopsided graph of their sock colors, take it seriously. Reading evidence and drawing an honest conclusion from it is the single most transferable skill in the whole research process.
What kids learn in this chapter
Recommended ages: 4-8
- Read and create basic charts and graphs
- Identify patterns and outliers in data
- Draw conclusions from evidence
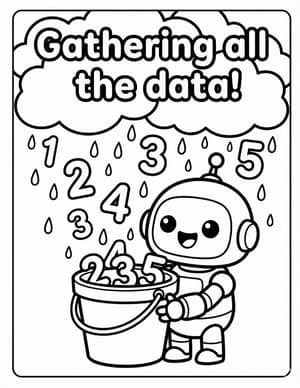
Page 61: Data Rain
Gathering all the data!
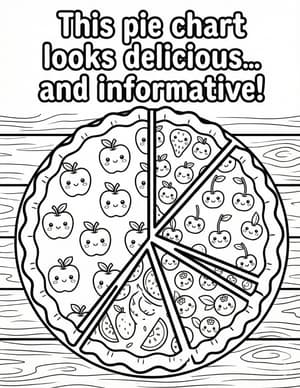
Page 62: The Pie Chart
This pie chart looks delicious... and informative!
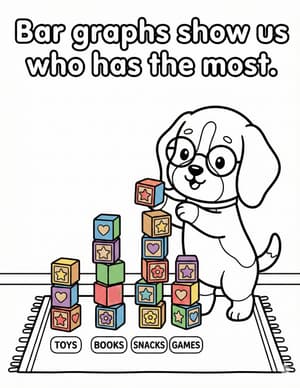
Page 63: The Bar Graph
Bar graphs show us who has the most.
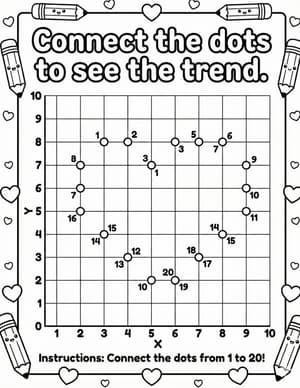
Page 64: Connect the Dots
Connect the dots to see the trend.

Page 65: The Outlier
Can you spot the outlier? He is different from the rest!
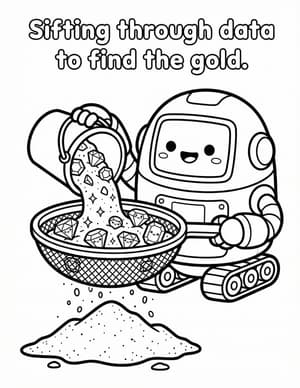
Page 66: Filtering
Sifting through data to find the gold.
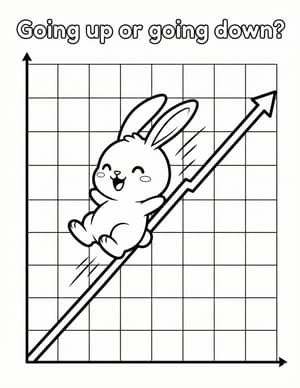
Page 67: The Trend Line
Going up or going down?

Page 68: Coding Data
Computers help us read the big numbers.

Page 69: The Magnifying Glass
Analyzing means looking very closely.
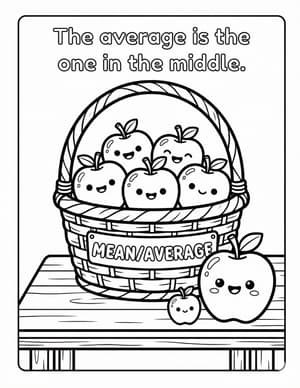
Page 70: Bin of Averages
The average is the one in the middle.

Page 71: Correlation
When the sun is hot, ice cream melts!
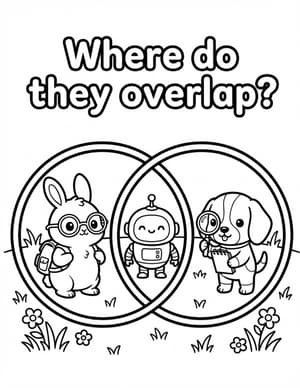
Page 72: Venn Diagram
Where do they overlap?
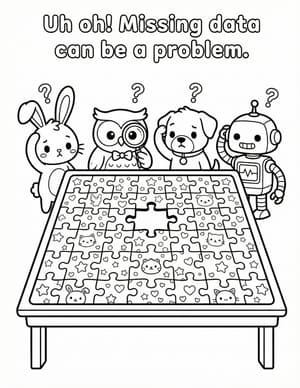
Page 73: Missing Data
Uh oh! Missing data can be a problem.
Page 74: The "Eureka" Moment
We found the answer!
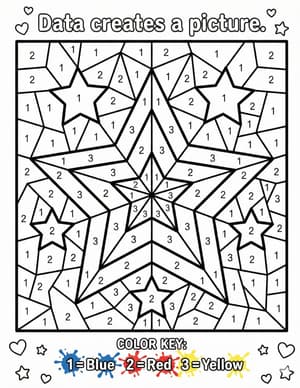
Page 75: Coloring by Numbers
Data creates a picture.
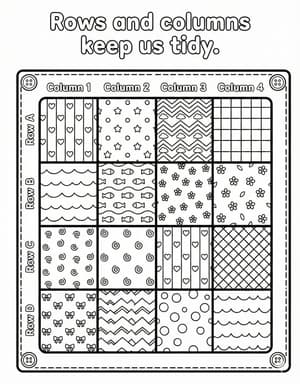
Page 76: The Spreadsheet
Rows and columns keep us tidy.

Page 77: Negative Results
Even a 'No' is a discovery!
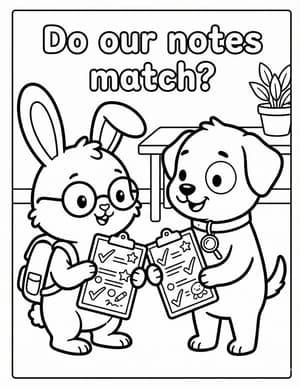
Page 78: Comparing Notes
Do our notes match?
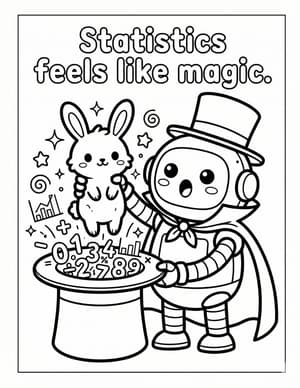
Page 79: Statistics Magic
Statistics feels like magic.
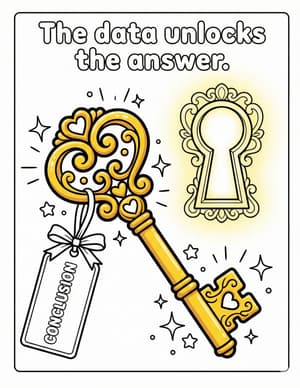
Page 80: The Conclusion Key
The data unlocks the answer.